Reports
Access all reports from the Reports menu in the menu bar. The menu is organized into submenus: Inventory, Routing, and Diagnostics, plus top-level entries for Change Summary, Topology Diff, and more.
Protocol-aware filtering: Seven OSPF-only reports (LSDB Browser, Neighbor Table, Inter-Area Routes, External Routes, IP Conflicts, Timer Consistency, Best Practices) are automatically disabled when only IS-IS areas are checked in the sidebar. Disabled reports show a tooltip explaining why they are unavailable (e.g., "OSPF only -- IS-IS uses LSPs, not LSAs"). When both OSPF and IS-IS areas are checked, all reports are available.
Most table-based report panels share these common features:
-
Search: Real-time text filtering across all visible columns. Supports two modes:
- Text mode (default): Case-insensitive substring match. Behaves like a standard search box.
-
Regex mode: Click the
.*button next to the search input to toggle regex mode (the button highlights when active). Use regular expression patterns for advanced filtering:-
gw|cr-- match rows containing "gw" OR "cr" -
^10\.-- match rows starting with "10." -
\d{3}-- match rows containing three consecutive digits -
0\.0\.0\.0-- match literal IP address (dots escaped)
-
- Invalid regex patterns (e.g.,
[unclosed) show a red border on the input and fall back to literal substring match, so typing is never broken. - The regex toggle is hidden on panels that use server-side search (CDP/LLDP Neighbors, and Prefixes/External Routes/Inter-Area Routes in live mode), since the server does not support regex. In time-travel (historical) mode, these panels switch to client-side filtering and the toggle appears.
- Column configuration: Click the gear icon to show/hide columns and drag-to-reorder.
- Sorting: Click any column header to sort ascending, click again for descending.
- CSV export: Download the current (filtered, sorted) view as CSV.
- Resizable panel: Drag any edge or corner handle to resize. Minimize to the pill bar to temporarily dismiss without losing scroll position or column configuration.
Column visibility and order persist across sessions via user settings.
Reports > Inventory > Routers
Lists all discovered routers (OSPF and IS-IS). When IS-IS areas are checked, an additional System ID column appears. CSV export filename: routers.csv.
| Column | Default Visible | Description |
|---|---|---|
| Router ID | Yes | OSPF router ID or IS-IS system ID |
| System ID | Yes (IS-IS) | IS-IS system ID (XXXX.XXXX.XXXX); shown when IS-IS areas are included |
| Name | Yes | Display name (per system name mode) |
| Vendor | Yes | SNMP sysDescr-derived vendor |
| Model | Yes | Device model |
| Platform | Yes | Hardware platform |
| Version | Yes | Software version |
| Role | Yes | ABR, ASBR, and/or Collector badges |
| Areas | Yes | OSPF area or IS-IS level memberships |
| Device Type | Yes | Router, switch, firewall, etc. |
| First Seen | No | First discovery timestamp |
| Last Seen | No | Most recent update timestamp |
Reports > Inventory > Links
Lists all IGP adjacencies (OSPF and IS-IS). When IS-IS areas are checked, additional System ID columns appear and link type shows "broadcast" instead of "transit". CSV export filename: links.csv.
| Column | Default Visible | Description |
|---|---|---|
| Source | Yes | Source device display name |
| Target | Yes | Target device display name |
| Source IP | Yes | Source interface IP address |
| Target IP | Yes | Target interface IP address |
| Cost (fwd) | Yes | Forward IGP cost (OSPF cost or IS-IS metric) |
| Cost (rev) | Yes | Reverse IGP cost |
| State | Yes | Link state with color badge (green=up, red=down) |
| Source RID | No | Source router ID |
| Target RID | No | Target router ID |
| Source System ID | No (IS-IS) | Source IS-IS system ID; shown when IS-IS areas are included |
| Target System ID | No (IS-IS) | Target IS-IS system ID; shown when IS-IS areas are included |
| Source Interface | No | Source interface name |
| Target Interface | No | Target interface name |
| Speed | No | Link speed |
| Type | No | Link type (P2P, broadcast for IS-IS, transit for OSPF) |
| Area | No | OSPF area ID or IS-IS level |
Reports > Inventory > Interfaces
Lists all router interfaces. When IS-IS areas are checked, additional IS-IS timer columns appear. CSV export filename: interfaces.csv.
| Column | Default Visible | Description |
|---|---|---|
| Router | Yes | Router ID |
| Hostname | Yes | Device display name |
| Interface | Yes | Interface short name (e.g., Gi0/0/1) |
| IP Address | Yes | Interface IPv4 address; dual-stack interfaces stack the IPv6 address beneath it |
| DNS Name | Yes | Reverse DNS (PTR) for the interface IP |
| Mask | Yes | Subnet mask; dual-stack interfaces stack the IPv6 prefix length beneath it |
| Peer | Yes | Peer router ID |
| Cost | Yes | IGP interface cost/metric |
| Type | Yes | Link type |
| Speed | No | Interface speed |
| Description | No | ifAlias description |
| Full Name | No | Full interface name (ifDescr) |
| Hello Int. | No | OSPF hello interval (seconds) |
| Dead Int. | No | OSPF dead interval (seconds) |
| Auth Type | No | OSPF authentication type |
| Net Type | No | OSPF network type |
| IS-IS Hello | No (IS-IS) | IS-IS hello interval; shown when IS-IS areas are included |
| IS-IS Hold | No (IS-IS) | IS-IS hold time; shown when IS-IS areas are included |
| IS-IS Metric | No (IS-IS) | IS-IS interface metric; shown when IS-IS areas are included |
| Circuit Type | No (IS-IS) | IS-IS circuit type; shown when IS-IS areas are included |
| Level | No (IS-IS) | IS-IS interface level; shown when IS-IS areas are included |
| First Seen | No | First discovery timestamp |
| Last Seen | No | Most recent update timestamp |
Reports > Inventory > Software Versions
A specialized report (not a standard table) that groups devices by software attribute for fleet-wide analysis.
- Group-by selector: Choose how to group: by Software Version, Vendor, Platform, or Vendor + Version combination.
- Summary bar: Shows total device count and number of distinct groups.
- Group rows: Each row shows the group name, device count, and a percentage distribution bar. The group with the fewest devices is highlighted with a "rarest" badge.
- Expandable rows: Click any group to expand and see the individual devices in that group with their router ID, hostname, and additional details.
- Search filter: Filter groups by name.
-
CSV export: Export the grouped data as
software-versions.csv.
Reports > Inventory > CDP/LLDP Neighbors
Lists all LLDP and CDP neighbor adjacencies discovered via SNMP across the network. Neighbors with only telephone capability (0x20) are excluded (IP phones, cameras).
- Summary bar: Total neighbor count, unique remote devices, LLDP count, CDP count.
- Columns: Local Device, Local Port, Remote Device, Remote Port, Mgmt IP, Protocol (LLDP/CDP/LLDP+CDP badge), Capabilities, Chassis ID, Platform, Software Version, Native VLAN, First Seen, Last Seen.
-
Software Version: Extracted from CDP (
cdpCacheVersion) or LLDP (lldpRemSysDesc). Long version strings are truncated at "Technical Support:" for readability. -
Native VLAN: Extracted from CDP (
cdpCacheNativeVLAN) when available. - Protocol merging: When both LLDP and CDP discover the same neighbor, the record shows "LLDP+CDP" and combines data from both protocols.
- Column configuration: Toggle column visibility, drag to reorder, resize. Settings are persisted in your user profile.
- Search: Free-text filter across all visible columns.
- Sort: Click any column header to sort ascending/descending.
-
CSV export: Export visible data as
l2-neighbors.csv. - Hide entries: Click the eye icon on any row to hide it from the report and the L2 canvas overlay. Hidden entries are excluded from SNMP-driven L2 topology views. The hide flag persists across discovery cycles — new polls do not reset it. To see hidden entries, check the "Hidden (N)" checkbox in the toolbar. Click the eye icon again to unhide.
Data source: GET /api/v1/l2-neighbors/network/{networkID}. Requires L2 enrichment to be enabled in SNMP settings.
Reports > Routing > LSDB Browser
A raw view of the OSPF link-state database, in 6 tabs: Router (Type 1), Network (Type 2), Summary (Type 3), ASBR (Type 4), External (Type 5), NSSA (Type 7).

The browser is OSPF-only. On an IS-IS-only selection the menu entry is disabled with the tooltip "OSPF only — IS-IS uses LSPs, not LSAs"; IS-IS state you would look for here lives elsewhere: overload/attached flags and per-level membership in the Node Detail Panel, adjacencies and timers in the link details. For automation, GET /api/v1/isis-lsdb returns raw IS-IS LSP headers (sequence number, remaining lifetime, overload/attached bits) — populated only where a GRE IS-IS recorder receives LSPs; it has no browser UI.
Common features:
- Summary badges: Each tab header shows a count badge with the number of LSAs/LSPs of that type.
- Expandable rows: Click any LSA/LSP row to see its full decoded content.
- Search filter: Filter by advertising router/system ID, link ID, or content.
- Auto-refresh toggle: Enable to automatically refresh the LSDB view every 30 seconds when topology updates occur. A manual Refresh button is also available.
Note: Age, Sequence Number and Checksum are live protocol header fields. They exist only where a GRE collector received the LSA over a real adjacency (the engine persists them); an LSDB reconstructed from SNMP walks has the LSA contents but no live headers. Where headers exist, the browser shows them as Age / Seq# / Cksum columns, with partial coverage disclosed as a count ("live LSA headers on X of Y shown"); where none exist, the summary bar states "(LSAge, SeqNo, Checksum not available)" instead of rendering zeroes that would look like freshly flooded LSAs.
The browser follows the Time Travel clock: at a historical time, topology and route LSAs reconstruct as of that moment, and the view refetches when you move the clock. Header metadata is not historized — a banner states that age/seq/checksum keep live values.
Reports > Routing > Neighbor Table
Shows IGP adjacencies (OSPF or IS-IS) per device. Also accessible via right-click > Show neighbors on any device.
- Device selector dropdown: Choose a specific device to view its neighbors, or view all devices.
- Summary bar: Shows total neighbor count with up/down breakdown (e.g., "12 neighbors: 11 up, 1 down").
- 9 displayed columns: Neighbor ID (with ABR/ASBR flag badges), Hostname, State (green/red dot with FULL/DOWN label), Address (local and remote IPs), Interface name, Cost (single value for symmetric, with forward/reverse arrows for asymmetric costs), Type (P2P, broadcast), Area, Last Seen.
-
CSV export: Exports 14 columns (including additional fields) as
neighbors.csv.
Reports > Routing > IGP Prefixes
Lists stub networks from the IGP LSDB (OSPF connected subnets and IS-IS IP reachability prefixes). This report is IGP-only — for BGP prefixes/routes, use the BGP Routes report. CSV export filename: prefixes.csv.
Columns: Network, Cost, Router, Area, First Seen, Last Seen.
The header shows the row count and, when they differ, the number of unique prefixes. Both are true at once: the same prefix legitimately appears once per area whose LSDB carries it — an IS-IS L2 backbone re-carries every L1 prefix propagated into it, so a network-scoped list over an L1/L2 domain holds more rows than prefixes. The Area column says which LSDB each row came from.
Reports > Routing > Inter-Area Routes
Shows Type 3 LSA summary routes learned via ABRs. CSV export filename: inter-area-routes.csv.
Columns: Network, Metric, Advertising Router, Router, First Seen, Last Seen.
Reports > Routing > External Routes
Shows Type 5 and Type 7 external routes. CSV export filename: external-routes.csv.
Columns: Network, Type (E1/E2 badge), Metric, Advertising Router, Router, Forward Address, NSSA (amber badge for Type 7 routes), Tag, First Seen, Last Seen.
Reports > Routing > BGP Peers
Lists all BGP peers discovered via BMP (BGP Monitoring Protocol). Requires at least one BMP target configured via the API -- see Setting Up BGP Monitoring.
| Column | Description |
|---|---|
| Peer IP | Remote BGP peer IP address |
| AS | Remote peer ASN |
| Type | Internal (iBGP) or external (eBGP) |
| AF | Address family (IPv4 / IPv6) |
| State | Peer state with colored dot (green = established, red = down) |
| Prefixes | Number of prefixes received from this peer |
| Router ID | Peer's BGP router ID |
| Last Seen | Most recent update from this peer |
- Search: Free-text filter across all columns.
- Pagination: Server-side, with configurable page size.
-
CSV export: Download filtered data as
bgp-peers.csv.
Reports > Routing > BGP Routes
Searches the BGP best-path table (engine-computed from BMP data). Supports three prefix match modes for flexible route analysis.
-
Match modes (selector next to the search field):
-
Exact: Returns only the prefix that exactly matches your search (e.g.,
10.0.0.0/24returns only10.0.0.0/24). - Longest match: Returns the most specific (longest prefix length) matching entry, like a router's forwarding table lookup.
-
Covered: Returns all prefixes that fall within the searched prefix (e.g.,
10.0.0.0/8returns10.0.0.0/24,10.1.0.0/16, etc.).
-
Exact: Returns only the prefix that exactly matches your search (e.g.,
| Column | Description |
|---|---|
| Prefix | BGP route prefix (CIDR notation) |
| On router | The selecting router — every BMP-monitored router computes its own best path, so the same prefix appears once per router. Essential with redundant route reflectors, which can legitimately pick different winners |
| Next Hop | BGP next-hop IP address |
| AS Path | Full AS path string |
| Origin AS | Originating ASN |
| LOCAL_PREF | BGP local preference value |
| MED | Multi-Exit Discriminator |
| Source | How the best path was determined: loc_rib (from router's own LocRIB via BMP) or inferred (engine-computed best-path selection) |
| ECMP | Equal-cost multipath count -- the number of next-hops that tied across all 6 best-path comparison steps |
| Updated | Timestamp of last best-path change |
- Pagination: Server-side with offset capped at 100,000 to prevent slow queries on large RIBs. Use prefix/AS filters to narrow results.
-
CSV export: Download filtered data as
bgp-routes.csv.
Tip: ECMP count > 1 means multiple BGP next-hops had equal LOCAL_PREF, AS path length, origin, MED (for same-origin AS), and IGP cost. This is useful for verifying load-balancing behavior.
The best path is the winner; the table can also show the candidates it beat. A route whose selecting router received more than one path for the prefix carries a chevron ("Show N paths"). Expanding it loads the received paths inline, one row per peer: a BEST/alt marker, next hop, AS path, origin AS, LOCAL_PREF, MED, the peer that sent it (IP, with router ID in parentheses when it differs), the IGP metric to the next hop, and communities (regular | extended | large, hover for the full string). This is show ip bgp <prefix> for that router, read from BMP.
The expansion follows the time-travel clock. At a historical time it serves the candidates recorded then, which requires a BMP target recording full history (history_mode: "full") for the AS — without it no candidates were recorded at that time, the path count reads 0 and rows offer no expansion.
Hover a route row and click the ↺ replay button to open the change replay for that prefix — a focused view of how that one route changed over time. It requires BGP history recording (a BMP target with a history mode other than off — see the target's settings), and it works on the same timeline as Time Travel: there is no second clock. The window opens as a fixed span (±12 hours) around the moment you were looking at.
- Event strip: a density band across the window — announcements and attribute changes above the line, withdrawals below, with small ticks for peer session changes. A vertical line marks the current time; click anywhere on the strip to jump the whole app's clock to that instant.
- Event table: every change in time order, showing the old → new next-hop and AS-path side by side. The row for the current time is highlighted. Click a row (or use the ◀ / ▶ buttons) to step to that change. Reconciliation entries (recorded when monitoring resumes) are labelled and can be hidden; a busy window that exceeds the display cap shows a banner asking you to narrow the range.
- On the map: while the replay is open, the followed prefix's exit is drawn on the topology canvas as an animated dashed line from the router holding the route to its next-hop router, with everything else dimmed. Routers whose BGP session flaps at the cursor time pulse briefly.
- Compare: click Compare to pin the current time as T1, then scrub the timeline — the view lists exactly what changed between T1 and where you scrub to (paths added, removed, or with new attributes). Useful for confirming "what did this maintenance window actually change".
- Candidate paths (full mode only): if the BMP target records full history (all received paths, not just the winner), a panel lists every candidate path from each peer at the cursor time, with the selected best one marked — so you can see why the best path changed (for example, the previous best peer withdrew, or a higher-local-preference path arrived). On best-path-only targets this panel shows a short "requires full mode" note instead.
Reports > Routing > BGP AS Flow
Where the replay follows one prefix, AS Flow steps back and shows the whole picture: which autonomous systems your routes reach the internet through, and how that shifts over time. Autonomous systems appear as bubbles sized by how many of your best paths pass through them, laid out left-to-right — your own AS, then your upstreams, then transit, then the origin ASes — with animated flows between them weighted by route count. Pick an AS to inspect (any BMP target with history recording enabled), and scrub or play a ±12-hour window.
- Timeline & play: the strip along the bottom shows event density — announcements and changes above the line, withdrawals below, diamonds for session flaps. Press Play to watch the graph reflow: bubbles and flows grow and shrink in place as routes move between upstreams — playback automatically slows down through eventful stretches so changes stay visible — and a neighbour pulses when its session flaps at that moment. While the cursor is inside an eventful stretch, affected ASes carry +N/−N badges and a one-line summary appears under the graph (for example "↷ 3 prefixes re-homed AS3356 → AS1299"); these stay while you pause and re-appear when you scrub back over the event. Step buttons jump to the next or previous change.
- Diff T1↔T2: click Diff to pin the current instant, then move the cursor. A movers panel breaks down exactly what changed — how many prefixes shifted from one upstream to another, how many were announced or withdrawn — as a flow diagram, with a table whose sample prefixes each open the per-prefix replay. Flows on the graph recolour green where an AS gained share and red where it lost.
- AS dossier: click any AS bubble to open its dossier — a share trend over the window, churn (routes gained / lost / rerouted), shadow share (how many prefixes depend on this AS as their only path versus a backup — full-history targets only), the top prefixes flowing through it (each opens the replay), the exit routers it is reached through (each sets the map to that instant), and the health of your sessions to it.
The view is a lens over recorded history — it needs a BMP target with a history mode other than off.
Reports > Routing > EVPN
The EVPN browser lists every discovered EVPN instance (EVI). An EVI here is a route-target equivalence class of what your BMP feeds observe -- observations from redundant route reflectors are merged and members are deduplicated per PE, so a dual-RR fabric shows one instance, not two. Each row carries:
- Service kind -- E-LAN (multipoint, discovered from IMET routes) or EVPN-VPWS (point-to-point, from per-EVI Ethernet A-D routes)
- Encapsulation -- VXLAN or MPLS, from the route's tunnel-encapsulation attribute
- Members and MACs -- how many PEs participate, and the total MAC count across them
Click an EVI to open its detail: per-PE member rows (VTEP or PE address, VNI or label, per-PE MAC and IP counts derived from MAC/IP type-2 routes -- aggregated live by the engine, never a per-MAC table), on-map / off-view placement chips, attached Ethernet Segments (multihomed access, with the PEs on each segment), and the instance's recent events -- MAC moves and PE losses, newest first.
Selecting an EVI also focuses it on the canvas: its on-map member PEs highlight and membership edges draw between them -- deliberately the same visual grammar as VPLS and L3VPN. The honesty ribbon applies here too: the edges show control-plane membership from BGP routes, not the data path packets take.
Two symptom events feed the incident system from this data:
-
evpn_mac_move-- a host moved between PEs, detected via the RFC 7432 MAC-Mobility sequence. All-active multihoming is understood: a MAC advertised by several PEs on the same Ethernet Segment is aliasing, never a move. A per-MAC debounce and a per-target hourly ceiling keep a broadcast storm from becoming an event flood. -
evpn_pe_lost-- a PE dropped out of an EVI, fired only when no live BMP feed still sees the membership. A BMP session going down is a monitoring gap, never treated as a withdrawal.
Both are symptoms: they attach to the co-incident device or link failure and never open an incident of their own. A lone MAC flap tells you something moved; the incident tells you why.
If a BMP target disconnects, its EVPN observations are flagged stale and the panel says so -- Osprey never presents last-known state as live.
Reports > Routing > EIGRP Topology -- appears only on networks with a discovered EIGRP instance.
EIGRP has no link-state database, so this view is stitched from every device's own neighbor table (the same way as L2/LLDP) rather than computed from an LSDB. Every resolved (device, remote) pair is folded to one row per physical adjacency, with an honesty marker for bidirectional (both ends confirm each other) versus half adjacencies (only one side is known).
Right-click a device that runs EIGRP for a second, per-device view: EIGRP topology from here replaces "SPF tree from here" in its context menu -- EIGRP runs DUAL, not Dijkstra, so it has no SPF tree, just that device's own list of neighbors. This per-device view works in any canvas scope, including the unscoped global topology.
Reports > Diagnostics > Topology Health
Client-side analysis that scans the current topology for issues. Results are grouped into 5 categories, each collapsible:
- Down Links (error severity): Links in a non-operational state.
- Asymmetric Costs (warning severity): Links where forward and reverse IGP costs differ.
- Isolated Devices (error severity): Routers with no active adjacencies (excludes collector nodes).
- Single-Homed Routers (info severity): Devices with only one link (potential SPOFs).
- ABR Anomalies (warning severity): ABRs with unexpected area memberships.
A summary bar at the top shows error/warning/info counts. Each finding is clickable -- selecting it highlights the affected device or link on the canvas. Device names respect the system-wide Device Name Format setting (Admin > System Settings > Display) -- showing hostnames, DNS names, router IDs, or hostname+IP depending on your configuration. CSV export filename: topology-diagnostics.csv.
Reports > Diagnostics > IP Conflicts
Detects four categories of IP address conflicts, displayed in tabs:
- Duplicate Router IDs: Multiple devices using the same OSPF router ID or IS-IS system ID.
- Duplicate IPs: Multiple interfaces on different devices with the same IP address.
- Duplicate Prefixes: The same stub network advertised by 3+ devices (normal for 2 on point-to-point links).
- External Conflicts: External routes for the same prefix with different metrics or types from different ASBRs.
Each tab shows severity badges (critical, warning). Click any finding to highlight it on the canvas. Device names respect the system-wide display name mode setting. CSV export filename: ip-conflicts.csv.
Reports > Diagnostics > Single Points of Failure
Identifies network reliability risks using graph theory, displayed in 2 tabs:
- Articulation Points: Devices whose failure would partition the network. Shows how many disconnected segments would result.
- Bridge Links: Links whose failure would partition the network.
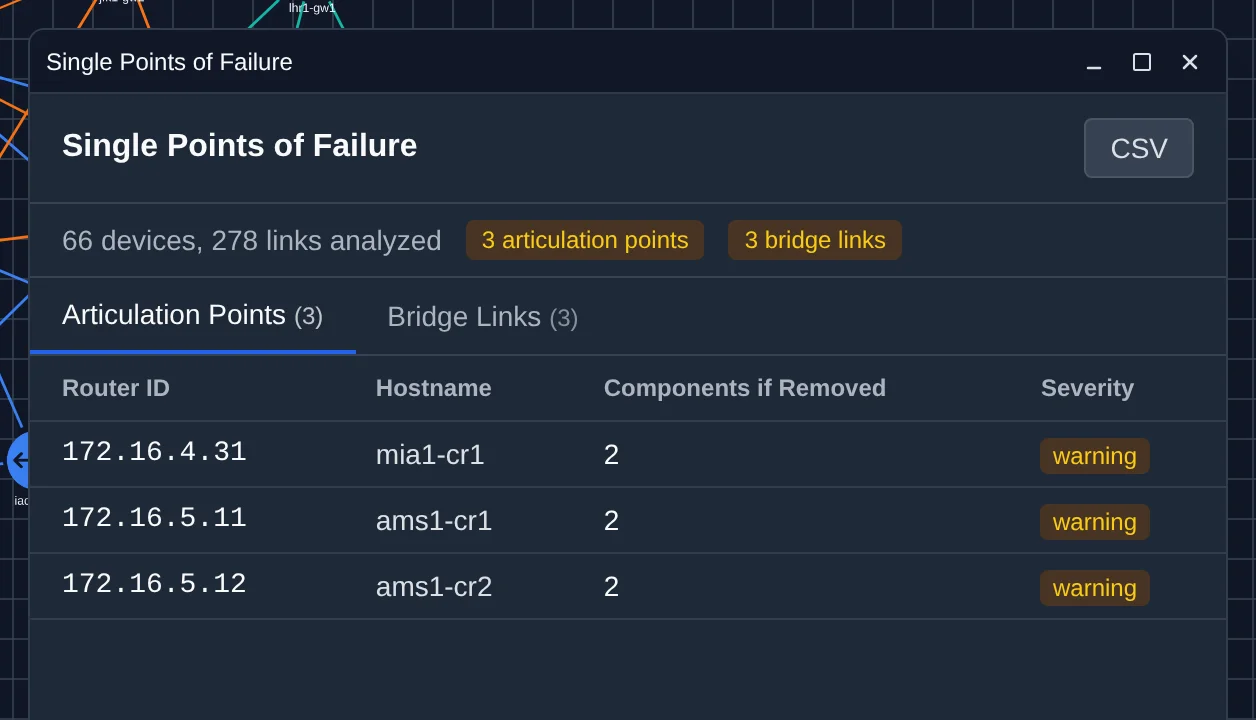
Severity levels: critical (red) for high-impact SPOFs affecting 3+ segments, warning (yellow) for lower impact (2 segments). Results are sorted by impact descending. Click any finding to highlight it on the canvas. Device names respect the system-wide display name mode setting. CSV export filename: spof-report.csv.
Reports > Diagnostics > Routing Stability
Analyzes topology event patterns to identify flapping links, unstable devices, and area-level instability. Displayed in 3 tabs:
- Flapping Links: Links with frequent state changes. Severity-coded by transition count: critical (10+ transitions, red), warning (5-9, yellow), info (2-4, blue).
- Unstable Routers: Devices with high event counts. Severity: critical (50+ events), warning (20-49), info (fewer than 20).
- Area Scores: Per-area instability scoring based on event density. Each area receives a numeric stability score derived from the total event count relative to the number of devices and links in that area. Higher scores indicate more volatile areas that may warrant investigation. Areas are sorted by score descending.
Period selector: 1 hour, 6 hours, 24 hours, or 7 days. CSV export filename: stability-report.csv.
Reports > Diagnostics > Congestion Trend
Identifies interfaces with sustained high utilization over configurable periods. Requires SNMP targets configured and hourly utilization bucketing data.
- Period selector: 24 hours, 7 days, or 30 days.
- Threshold selector: 60%, 70%, 80%, or 90% utilization.
| Column | Description |
|---|---|
| Device | Device display name |
| Interface | Interface name |
| Speed | Interface speed |
| Max % | Peak utilization in the period |
| Avg % | Average utilization in the period |
| Hours Above | Hours above the selected threshold |
| Trend | Direction indicator (increasing, stable, or decreasing) |
| History | Inline sparkline chart showing utilization over time |
CSV export filename: congestion-trend.csv.
Reports > Diagnostics > Timer Consistency
Detects IGP timer and configuration mismatches across link endpoints. Supports both OSPF and IS-IS links. Requires the SNMP poller to have walked the OSPF-MIB or ISIS-MIB interface table.
- Summary bar: Shows total endpoints checked and mismatch count.
- Mismatches table with 5 columns: Parameter (with severity badge), Side A (device name), Value A, Side B (device name), Value B.
Severity levels:
- Critical: Hello interval, dead/hold interval, or authentication type mismatches (these prevent adjacency formation).
- Warning: Network type mismatches (OSPF) or metric type mismatches (IS-IS narrow vs. wide).
IS-IS-specific checks include hello interval, hold time, and metric width consistency. Best practice warnings are raised for IS-IS links still using narrow metrics (max 63).
Click any finding to highlight the affected link on the canvas. CSV export filename: timer-consistency.csv.
Reports > Diagnostics > MTU Mismatch
Detects MTU mismatches between interfaces on opposite ends of a link. Requires the SNMP poller to have walked IF-MIB ifMtu (.1.3.6.1.2.1.2.2.1.4), which is collected during the discovery interval (default 6 hours, configurable via Admin > System Settings > SNMP > Polling).
- Summary bar: Shows count of mismatched links.
- Mismatches table with 4 columns: Side A (device + interface + IP), MTU A, Side B, MTU B.
- Click any row to highlight the affected link on the canvas.
- CSV export filename:
mtu-mismatch-report.csv.
MTU mismatches are common on links between routers using different default MTUs (e.g., jumbo frames on one side, 1500 on the other). While OSPF uses interface MTU from the DBD exchange to detect this at adjacency formation, the MTU Mismatch report provides a topology-wide overview without requiring a GRE collector.
The MTU value also appears in the Link Detail Panel OSPF Configuration section and as a hidden column in Reports > Inventory > Interfaces (toggle via column picker).
Reports > Diagnostics > Best Practices
OSPF-only. Audits the topology for compliance with OSPF design best practices. Findings are grouped into categories:
- Backbone Design: Checks for non-contiguous backbone (area 0), ABRs not connected to area 0, etc.
- Stub Compliance: Verifies stub and NSSA area configurations.
- Router ID: Detects non-loopback router IDs and duplicate router IDs.
- Passive Interfaces: Flags stub networks on non-passive interfaces.
Each finding has a severity level (critical, warning, info) and lists the affected devices. Click any device to highlight it on the canvas. CSV export filename: best-practices.csv.
Note: IS-IS best practices checks are not yet available. When only IS-IS areas are selected, this report is disabled.
Reports > Change Summary
Shows a summary of recent topology changes with visual distribution analysis.
- Period selector: 1 hour, 6 hours, 24 hours, 7 days, or 30 days.
- Summary cards: Device changes (added/removed/changed counts), Link changes, and Stub Network changes with color-coded badges.
- Distribution chart: Visual breakdown of change types over the selected period.
- Other Events section: Lists topology events that don't fall into the device/link/stub categories.
Reports > Topology Diff
Compare topology at two points in time:
- Set the From and To timestamps using datetime pickers (defaults to last 24 hours).
- Click Compare.
- Results show in 3 tabs: Devices, Links, Stub Networks.
- Each entry shows whether it was added (green), removed (red), or changed (amber) with summary badges per tab.
- Click any entry to highlight it on the canvas.
CSV export filename: topology-diff.csv. Useful for change review, maintenance window validation, and troubleshooting.
Reports > Dependency Impact
Analyzes upstream/downstream dependency relationships and failure impact across the topology. The report has three tabs:
- Peer AS: Summarizes BGP autonomous system dependencies. Shows each peer AS with prefix count, percentage of total prefixes, and a no-alternative ratio indicating how many prefixes are reachable only through that peer. Requires BMP targets configured with AS-scoped data. Expand any row to see the list of affected prefixes and alternate paths.
- Critical Pairs: Identifies device pairs whose simultaneous failure would partition the network or isolate significant portions of the topology. Each pair shows the number of affected devices and links. Expand any row to see the detailed failure impact (disconnected segments, traffic rerouting).
- SRLG / Devices: Lists SRLG groups and individual devices with failure impact analysis. Filter between SRLG groups, individual devices, or all. Each entry shows the number of affected prefixes, links, and devices if that entity fails. Expand any row to see detailed downstream impact.
Each tab supports expandable drill-down rows. Clicking a row header fetches impact detail lazily via a POST request, so large topologies remain responsive.