Follow the impact of Coronavirus outbreak in Latin America in real time.
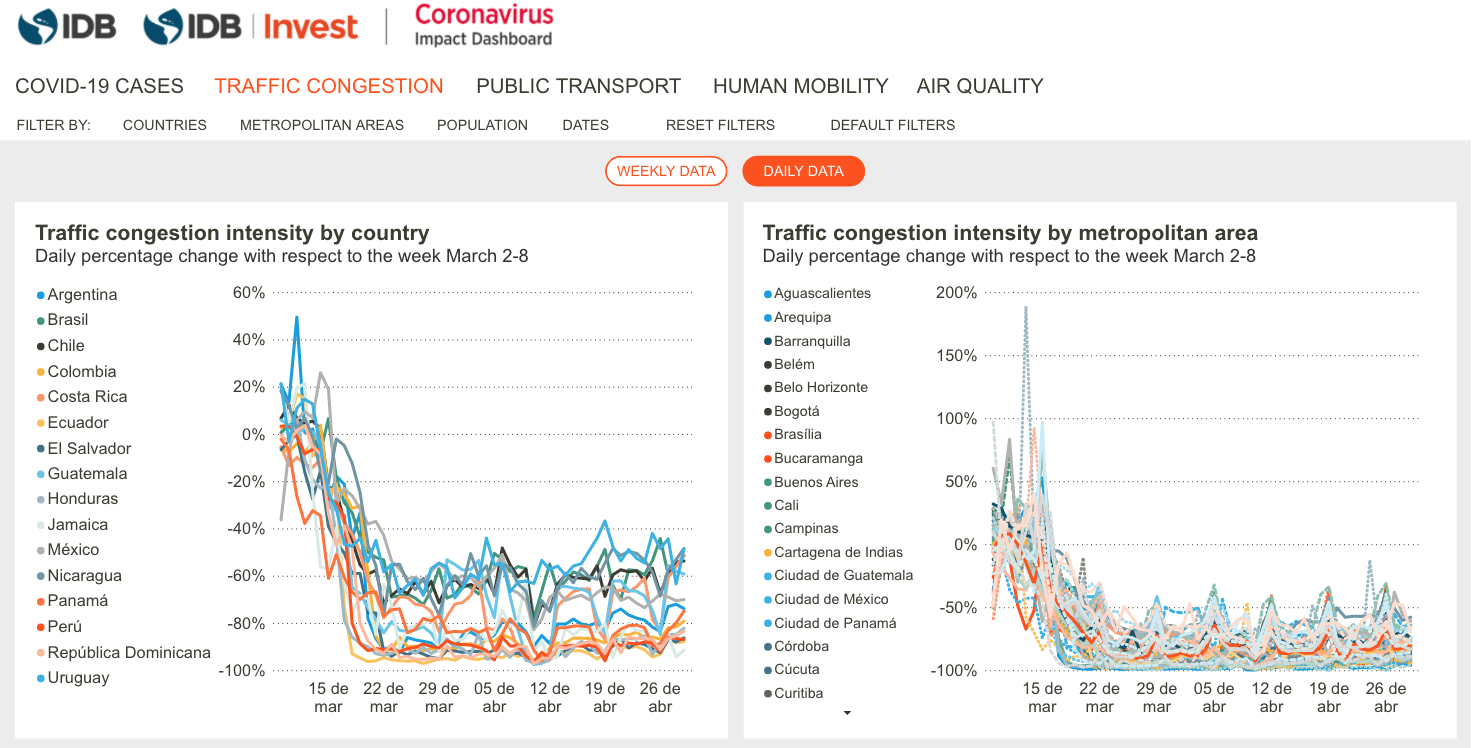 Go to dashboard: ENGLISH
ESPAÑOL
Go to dashboard: ENGLISH
ESPAÑOL
The Coronavirus Impact Dashboard has been created by the IDB and IDB Invest to track in real time the impact of the coronavirus (also known as COVID-19) on the countries of Latin America and the Caribbean. The dashboard aims to track a range of variables of interest in order to provide policymakers, epidemiologists, and the general public in the region with measures of the impact that “social distancing” restrictions and recommendations due to the coronavirus outbreak are having on the population and on economic activity.
The data was also though to be used by the broad community of researchers, journalists and developers. If you have any ideas or doubts about using the data, do not hesitate to submit an issue.
But first, make sure you understand the data:
- Data Dictionary
- The Methodological Note will also continuously track and update methodological changes (when necessary) and changes/additions to data sources. The version of the Methodological Note and its date of creation are shown at the top of the document.
The latest version of the data is easily available through the methods below.
Access the sheets
import pandas as pd

daily = pd.read_csv('[daily]')
weekly = pd.read_csv('[weekly]')
metadata = pd.read_csv('[metadata]')
library(readr)

daily<-read_csv('[daily]')
weekly<-read_csv('[weekly]')
metadata<-read_csv('[metadata])
import delimited using "[daily]", clear
import delimited using "[metadata]", clear
import delimited using "[metadata]", clear
You can find materials prepared for Waze for Cities Partnership Partners here.
The way that the pipeline was implemented allow us to query any region in Latin America. To ask for an specific region(s) of interest please submit an issue.
To cite the IDB and IDB Invest Coronavirus Impact Dashboard, please use the following reference:
Inter-American Development Bank and IDB Invest. "IDB And IDB Invest Coronavirus Impact Dashboard". 2020. Inter-American Development Bank.www.iadb.org/coronavirus-impact-dashboard
To cite this Methodological Note, please use the following reference:
Inter-American Development Bank and IDB Invest. IDB And IDB Invest Coronavirus Impact Dashboard Methodological Note. Washington, DC: Inter-American Development Bank, 2020.https://iadb-comms.org/coronavirus-impact-dashboard-methodological-note.
Development Effectiveness Division Chiefs
-
IDB: Carola Alvarez
-
IDB Invest: Alessandro Maffioli
Technical Team Leaders
-
IDB: Oscar Mitnik
-
IDB Invest: Patricia Yañez-Pagans
Technical Team
-
IDB: João Carabetta, Daniel Martinez, Edgar Salgado, Beatrice Zimmermann, Sonia Mendizabal
-
IDB Invest: Mattia Chiapello, Luciano Sanguino
Communications Team
-
IDB: Lina Botero, Andrés Gómez-Peña
-
IDB Invest: Norah Sullivan
IT Team
-
IDB: eBFactory
-
IDB Invest: Maiquel Sampaio de Melo
See the LICENSE.md file for details.
- This README was adapted from A template to make good README.md
- The structure of this repository was adapted from Fast Project Templates
This repository reflects the code being used in the most current version of the dashboard at the Traffic Congestion tab.
Copyright © [2025]. Inter-American Development Bank ("IDB"). Authorized Use.
The procedures and results obtained based on the execution of this software are those programmed by the developers and do not necessarily reflect the views of the IDB, its Board of Executive Directors or the countries it represents.
Copyright © [2025]. Banco Interamericano de Desarrollo ("BID"). Uso Autorizado.
Los procedimientos y resultados obtenidos con la ejecución de este software son los programados por los desarrolladores y no reflejan necesariamente las opiniones del BID, su Directorio Ejecutivo ni los países que representa.
Copyright © [2025]. Inter-American Development Bank ("IDB"). The Support and Usage Documentation is licensed under the Creative Commons License CC-BY 4.0 license. The opinions expressed in the Support and Usage Documentation are those of its authors and do not necessarily reflect the opinions of the IDB, its Board of Executive Directors, or the countries it represents.
Copyright © [2025]. Banco Interamericano de Desarrollo (BID). La Documentación de Soporte y Uso está licenciada bajo la licencia Creative Commons CC-BY 4.0. Las opiniones expresadas en la Documentación de Soporte y Uso son las de sus autores y no reflejan necesariamente las opiniones del BID, su Directorio Ejecutivo ni los países que representa.